What Do you Breathe When you Work out at the American University of Beirut?
Available at The Journal of High school Science: https://doi.org/10.64336/001c.146444
GitHub guide made for code accessibility: esp32-air-quality-logger
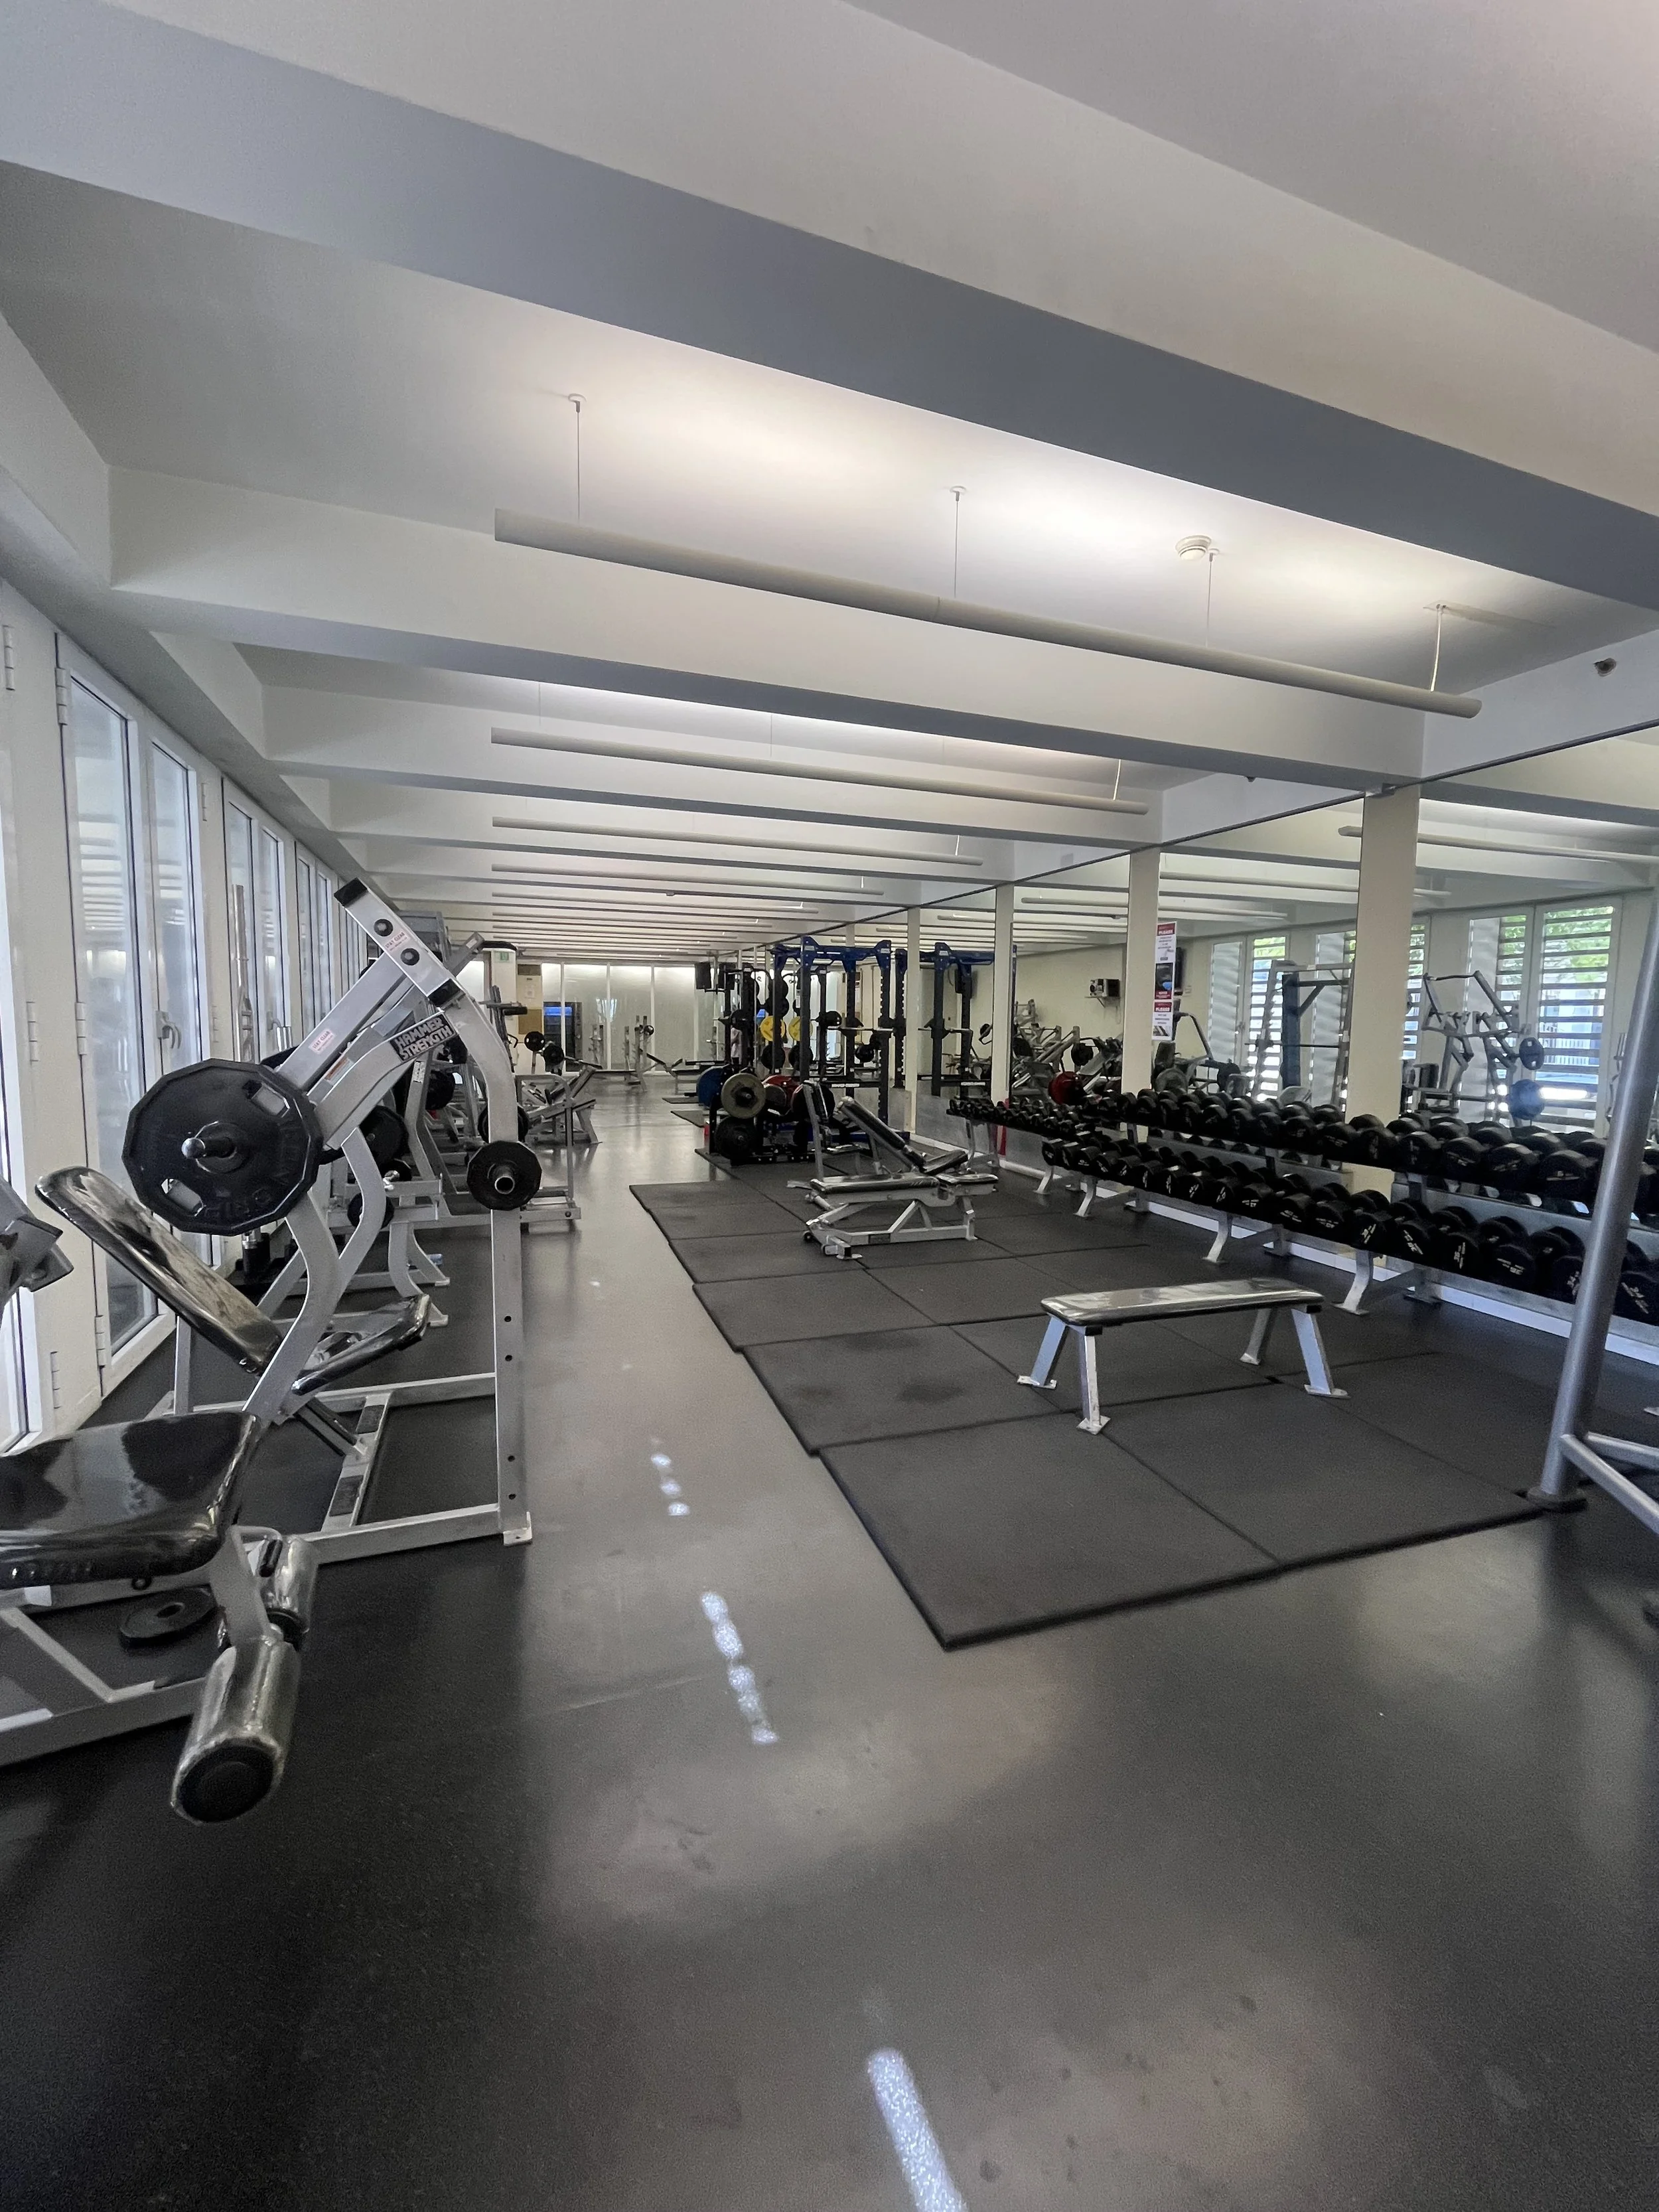
Regularly working out at the AUB weight room, I became curious about how effectively the space was being ventilated. To explore this, I developed a low-cost monitoring device that measures carbon dioxide and particulate matter, aiming to make ventilation assessment more accessible while discovering more about the environment I train in nearly every day.
What I found
The gym’s ventilation rate was 1.5 air changes per hour, meaning the entire volume of air was refreshed roughly 1.5 times per hour.
This ventilation rate supports a maximum occupancy of approximately 17 people.
According to health guidelines, PM₂.₅ levels showed only mild exceedances during opening hours.
I informed the gym about my findings to help ensure the environment stays safe in busier seasons.
Why I did it
Small enterprises and non-profits often lack affordable ways to test fresh air ventilation.
I developed a low-cost monitoring device for evaluating fresh air adequacy in the gym where I workout.
The device measured particulate matter, which frequently reaches dangerous levels in exertion places
It also measured carbon dioxide, a valuable indicator of ventilation effectiveness.
How I did it
Step 1: Making the device
This step transformed low-cost parts into a functional prototype capable of continuous indoor air monitoring

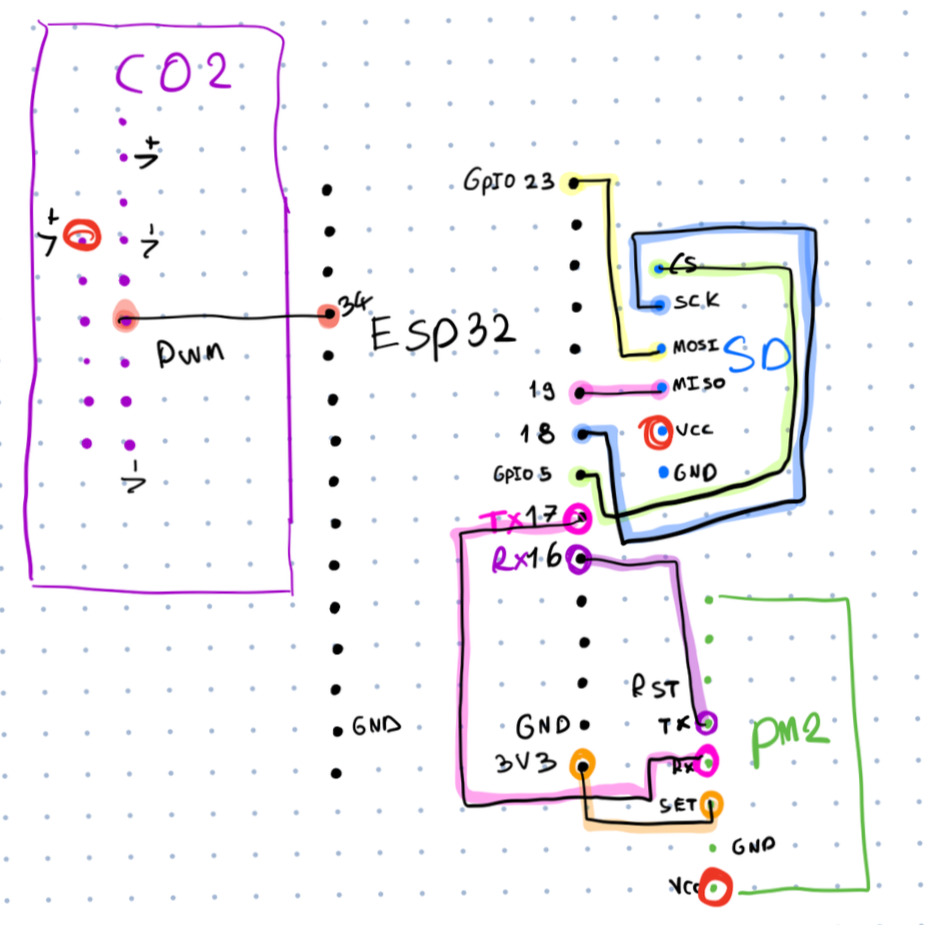
Prototyping the detailed wiring diagram

Component price list
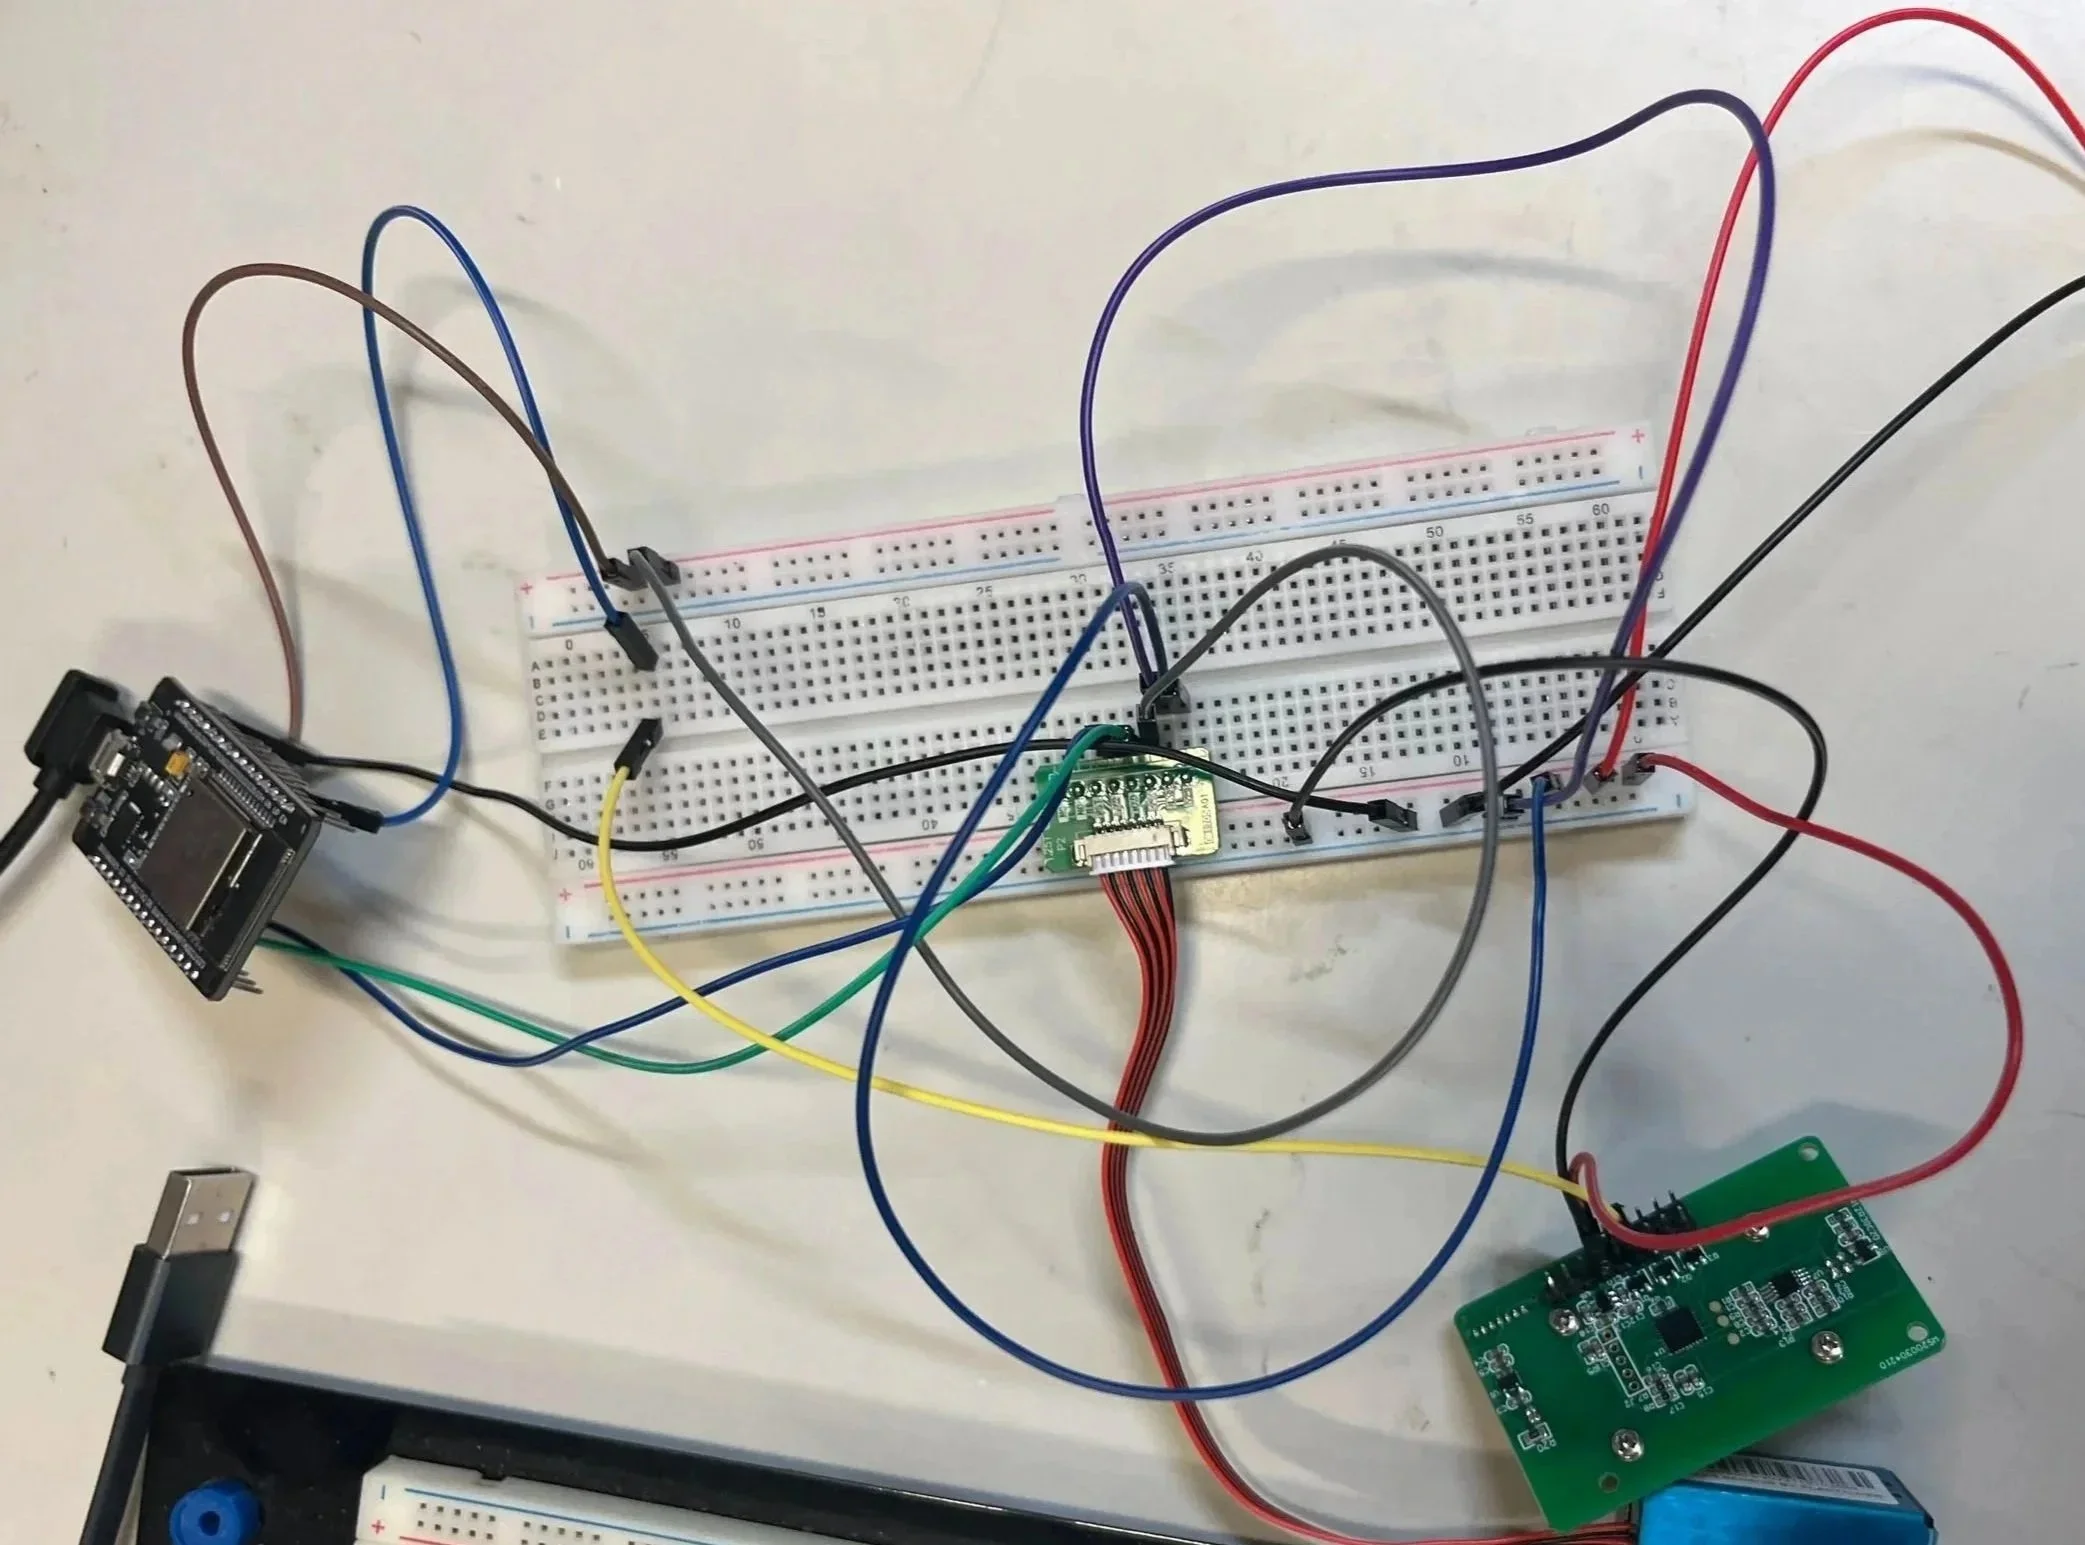
Testing and developing the prototype

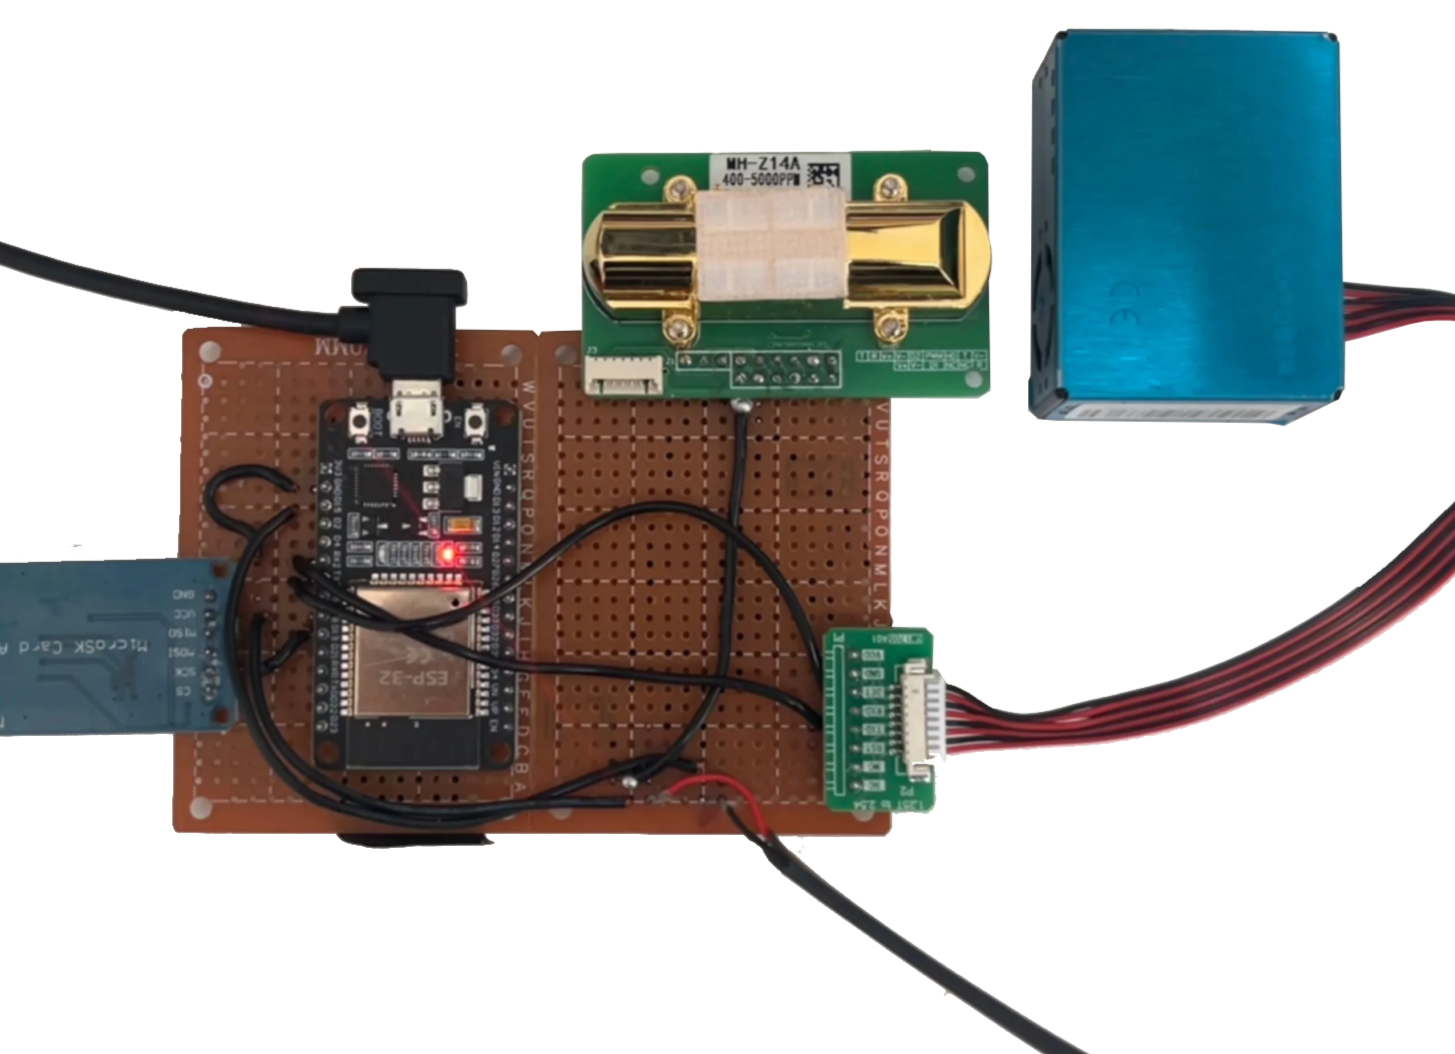
Making Sure Everything’s Wired Right at Home

I then embedded the full firmware into the ESP32 using Arduino IDE. The code reads CO₂ from the MH-Z14A sensor using pulse-width modulation (PWM), where the length of each high signal corresponds to gas concentration, and gathers particulate matter data from the PMS5003 over UART, a serial protocol that streams sensor data in structured frames. It logs all values with timestamps to both the SD card and serial monitor, while the microcontroller’s LED blinks as a heartbeat to confirm operation. I also attached the code I used for easy replication.
Embedding the code
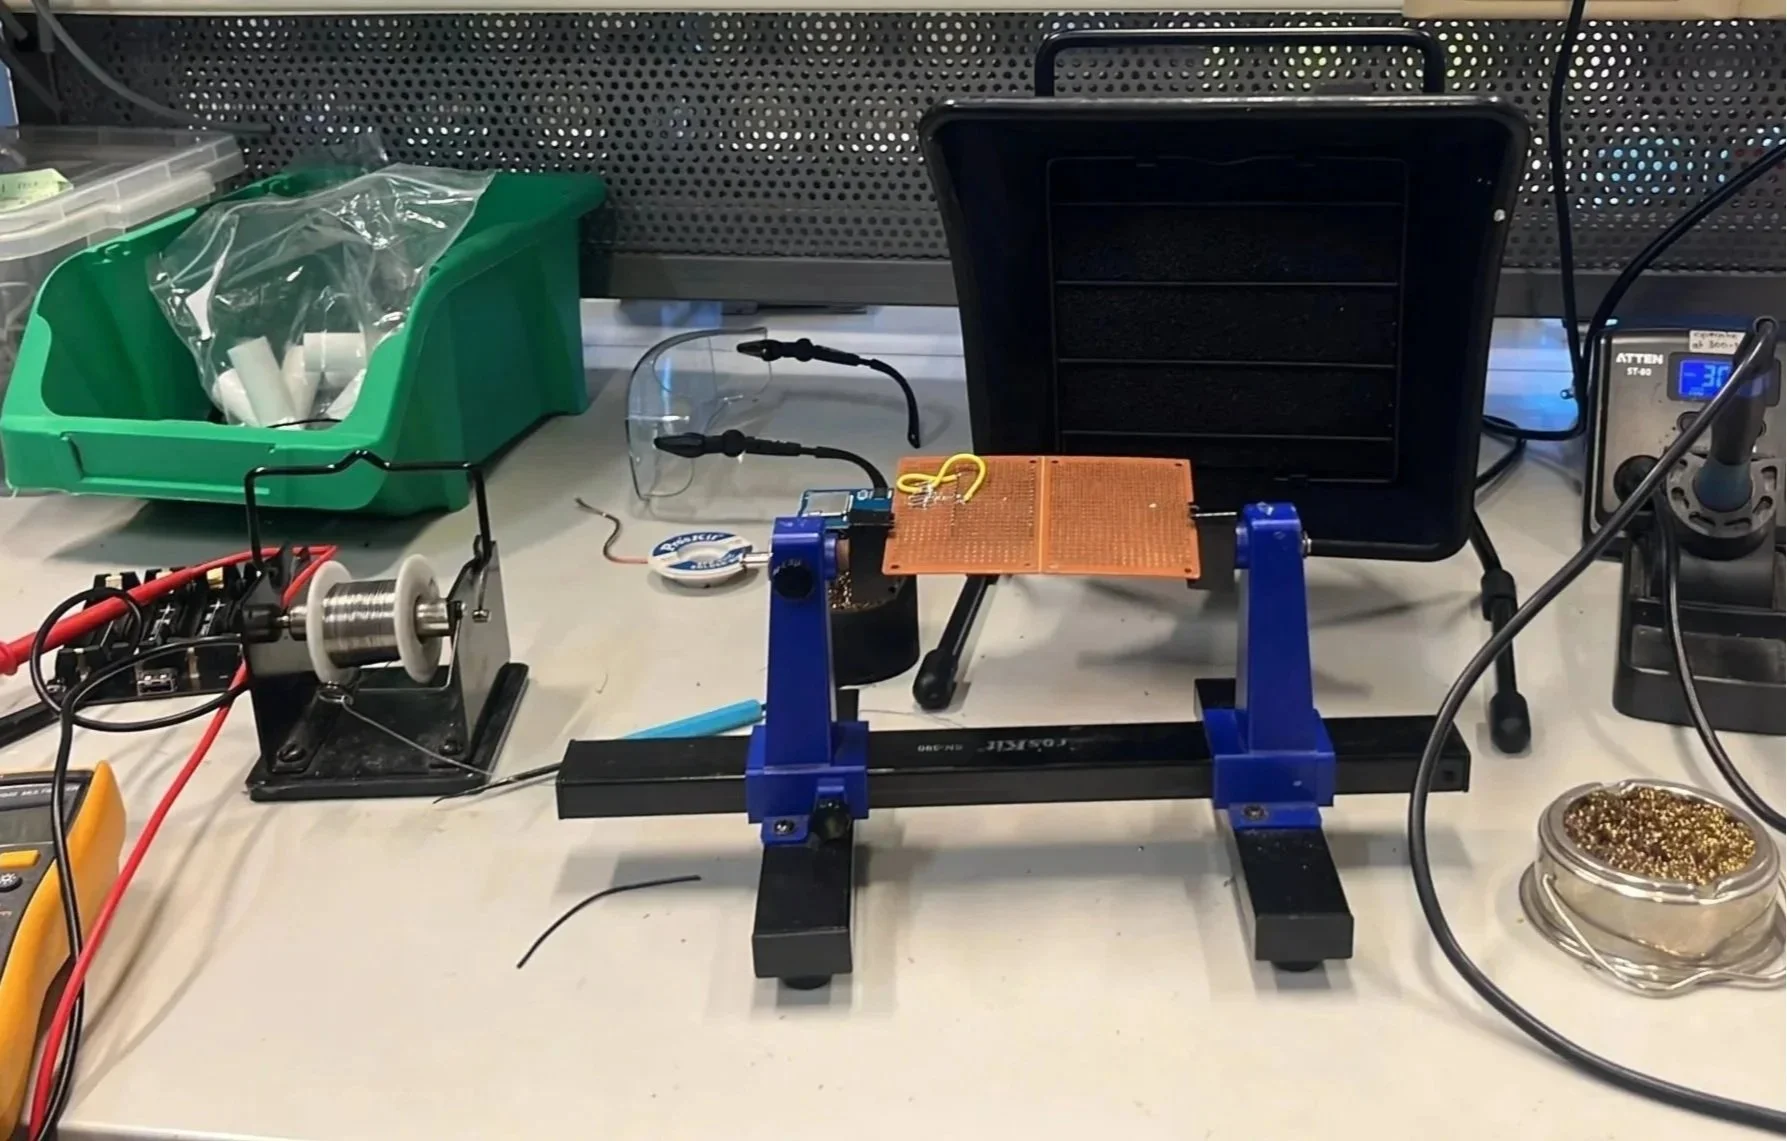
Soldering the components on a perfboard
Before deployment, I validated my custom sensor by comparing it against a professional Lutron CO₂ analyzer. During a 55-minute test, I enriched my kitchen with CO₂ and then increased ventilation by turning on the fan and opening the windows to observe the rise and decay phases. The two instruments tracked nearly identically, confirming that my low-cost system measured with lab-level precision.
Calibrating the device

Graph representing the data points of both devices during the monitoring period

Cross Calibration Experiment Setup
Step 1 complete!
The final product
Step 2: Gathering and Interpreting Data
Setup Details
I conducted 24-hour tests to verify:
Stability of UART communication between sensors and ESP32
Reliability of SD card data logging over extended periods
The device was powered by a 5V wall adapter
The monitor was placed away from open windows and direct air vents to minimize measurement bias
The monitor was mounted at breathing height inside a well cross-ventilated enclosure. The placement followed WHO guidelines for indoor air quality measurement.
Below is a sample from the raw data log, showing the CO₂ and PM values


The IAQ monitor set up in the gym, collecting data
Deployment Duration and Sampling
Duration: ~14 days (continuous)
Sampling Interval: Every 61 seconds
Data Points Collected: Approximately 20,000 timestamped records
Variables Tracked:
CO₂ concentration (ppm)
PM2.5 concentration (μg/m³)
Calculating Air Change Rate (ACR) and Estimated Max. Occupancy
Air change rates were calculated using the CO₂ decay method, which applies a multi-point regression approach with about 5% uncertainty under ideal conditions. Each night, I identified the start of the decay by locating the peak CO₂ value, as shown in the plotted data below.

The concentration of CO₂ in the room can be calculated using a mass balance, assuming that the room of volume V is uniformly mixed - represented in the figure below.
C(t) is the indoor concentration at time t ,Camb is the ambient (baseline) concentration, Q the volumetric airflow rate, and S is the internal source term representing CO₂ emitted by all occupants.

After determining the ACR, I converted it into the total amount of outdoor air supplied per second using the room’s volume. This airflow value was then compared with the ventilation requirements defined by ASHRAE Standard 62.1, which specify how much fresh air is needed per unit area and per person. By balancing these two components, I estimated the maximum number of occupants that the measured ventilation rate can safely support.
Step 2 complete!
More details about the calculations are included in the full research paper linked below.
Step 3: Extracting the Results
Results Overview
Average Air Change Rate 1.5 h⁻¹ ± 0.37 h⁻¹
Max Recommended Occupancy ~17 people
Average CO₂ Concentration 792 ppm
Peak PM₂.₅15.3 µg/m³ mild exceedance
Here’s a representative 24-hour profile of indoor CO₂ and particulate matter (PM) levels in the gym on a Saturday. The graph shows how CO₂ rises during opening hours (9:00 a.m.–4:30 p.m.) and drops afterward—the decay period used to calculate daily air change rates. PM levels fluctuate with HVAC operation, spiking at night when the system is off.
PM and CO₂ concentrations on Saturday, August 2, 2025, averaged over 0.1h intervals

For comparison, the Sunday profile stays flat, with CO₂ levels steady at baseline, confirming no occupancy.